DeltaSeas – Digital ship sails on all seas and in all weathers
In the previous blog text , Mia Elg described the methods that we have for evaluating vessel environmental footprint and energy efficiency. One of their major outcomes was that the operating profile of the vessel is of extreme importance.
This blog continues our digital ship design series by introducing DeltaSeas, which provides answers to this specific question. DeltaSeas addresses the challenges of optimizing ship performance across various weather conditions, ensuring efficient and reliable operations. Learn how this innovative tool integrates detailed weather and operational data to enhance ship design and performance.
What does the operational profile of a ship consist of?
Traditionally when designing, a ship is assumed to operate at design speed and calm water propulsion power with a 15% sea margin addition. Propulsion and machinery solutions are based on this. The figure can vary a bit depending on the ship owner’s wishes, but basically it is customary that sea area and operation philosophy are not reflected in ship design.
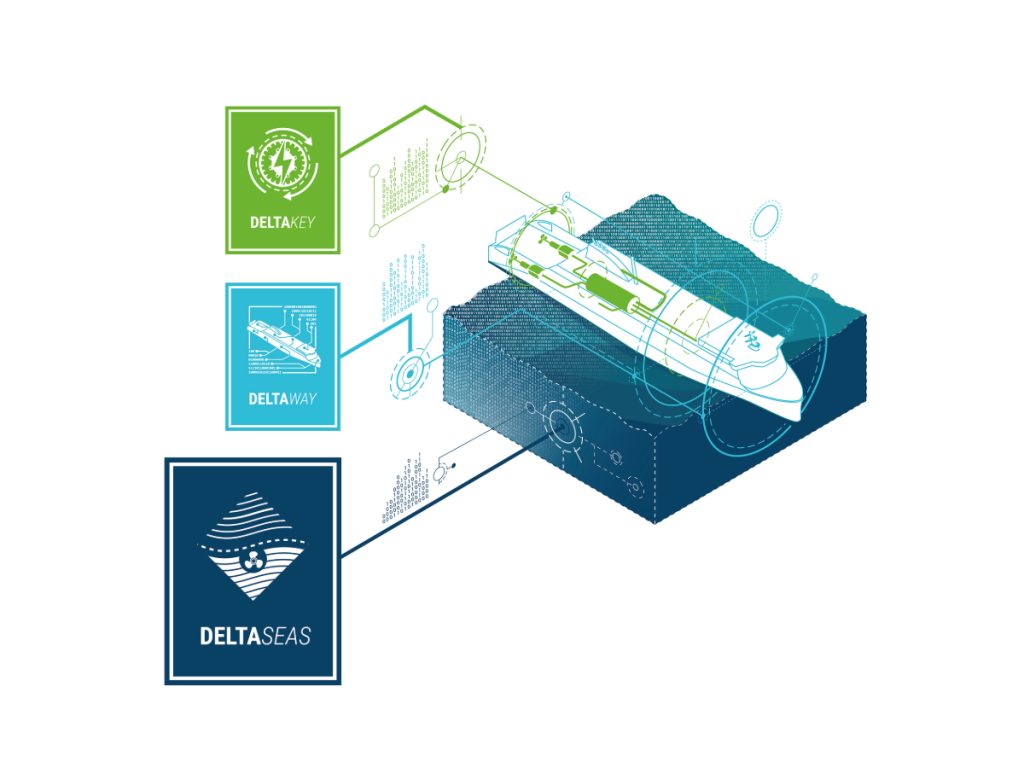
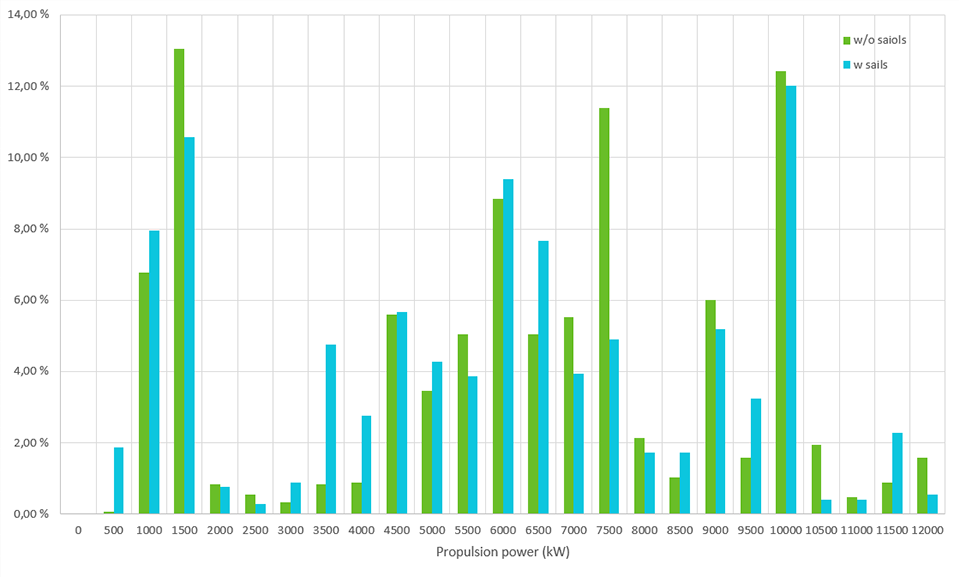
DeltaSeas is Deltamarin’s answer to this problem. Instead of a hypothetical optimisation point, all weather that the ship is supposed to meet is treated/combined within an expected speed profile. The result is a list of percentages for different levels of propulsion power. This variation of power need should be the basis of propulsion and machinery design in every ship every time everywhere in the future.
Our method is basically similar in newbuilding, retrofit, conversion and operation optimisation projects. Traditionally, schemes like this have been constructed to support operational efficiency, such as for weather routing. The greatest benefit regarding ship capex can be foreseen in moderate sea areas with a possibility to save machinery power. But in any case, there really is no excuse for knowing less about your ship’s realistic power demand, when you can know more.
What do we do in practice?
As mentioned, propulsion power is traditionally determined on single speed calm water resistance with a 15% sea margin added. DeltaSeas power distribution is based on speed distribution and resistance distribution at each speed.
Resistance calculation includes calm water, wave, wind and current performance. This can be achieved in many ways, sometimes with full simulations, sometimes with model tests, sometimes with potential theory calculations. It is easy to use several methods in one project, handling most of the cases with simpler methods and tackling the most complicated with more time-consuming options.
Most typical sources for resistance are CFD calculations, potential theory calculations and model test results. Having a large resistance variation for every speed, a large variation of propulsion power is also calculated. This is the end result of the analysis, which is typically a direct input to our energy team’s DeltaKey energy simulations.
Where does all this data come from?
The method requires understanding of the ship itself, the speed and draft profile according to which it is operated and the routes and weather.
In a new build, Deltamarin is normally the designer of the hull and knows best how it behaves. In a conversion, some part or all the ship properties may come from previous reports or other sources. Normally, we would take responsibility for everything related to this.
The operating profile regarding expected speed, area and schedule, on the other hand, is the thing that naturally comes from the owner. Here too, Deltamarin is always prepared to make educated guesses based on our large project back-log. In fact, DeltaSeas is our tool in optimising an operating profile, and the project may revolve entirely on iterating the correct operating profile.
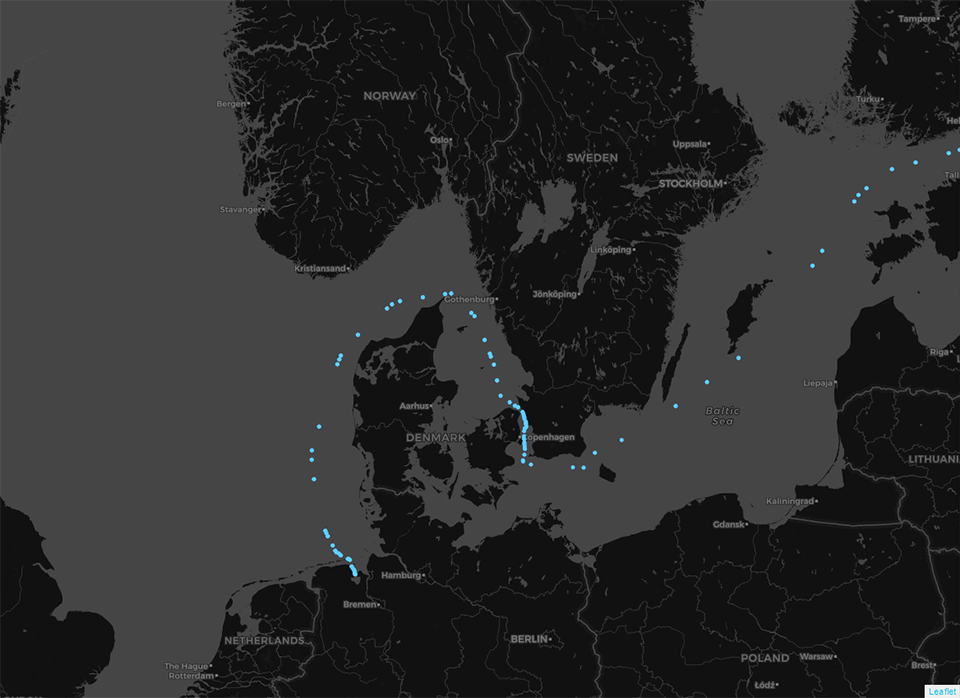
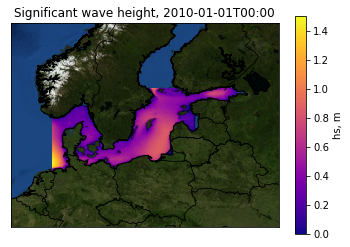
Metocean data is something which falls between these categories. The best data for a particular route is certainly the data collected on the route. A standard ship, however, usually only collects a limited set of variables, such as roll and pitch, and misses the more important ones like accurate wave height and period. The collected data is typically indirect in this sense. This makes hindcast data from the route attractive. It may come from various sources.
Present, future and future proofing
Deltamarin’s DeltaSeas is a flexible tool for evaluating a ship’s real propulsion power needs over its lifetime. We are already utilising it in almost all new projects and will continue to do so. We are also looking to find more data to validate it for a large variety of vessel types.
You may find practical examples of the DeltaSeas profile in our digital design portal, where a simple speed profile is combined with statistical weather data from a 30-year period. The power and usability of the method was highlighted last year in a consultation project, which we did for Equinor and partners regarding lowered carbon footprint of a new-build vessel. There were various operational strategies considered for the vessel even on a single route, with available measured data for the nearby weather stations for the past decades. This all resulted in very different power distributions, and all the studied technologies were simulated with these various power patterns. The customer could get a clear picture of the most profitable technology mix for the most likely operation pattern, and impact on EEDI could even be evaluated.
Want to read more? See also our other published blogs.
For more information, please contact:
Jyri-Pekka Arjava
Senior Naval Architect
jyri-pekka.arjava@deltamarin.com