Offshore energy goes green: FPSO environmental performance case study
In my first blog post, I briefly introduced the latest tools and methods we have been developing for analysing energy efficiency and environmental performance of various types of offshore units and marine vessels. These units and their systems have become so complex that performing energy analysis in the traditional way with ‘dummy’ Excel calculations sheets has become challenging, or at least too time-consuming. Results are also inaccurate. To fill this gap, we have developed an in-house simulation tools and a holistic analysis method. If you haven’t read it yet, you can find it here.
This time, I’ll take one step forward and discuss the benefits of our in-house simulation tool through a more practical FPSO environmental performance case study. I hope you’ll find it interesting and useful!
Energy & Environmental performance study
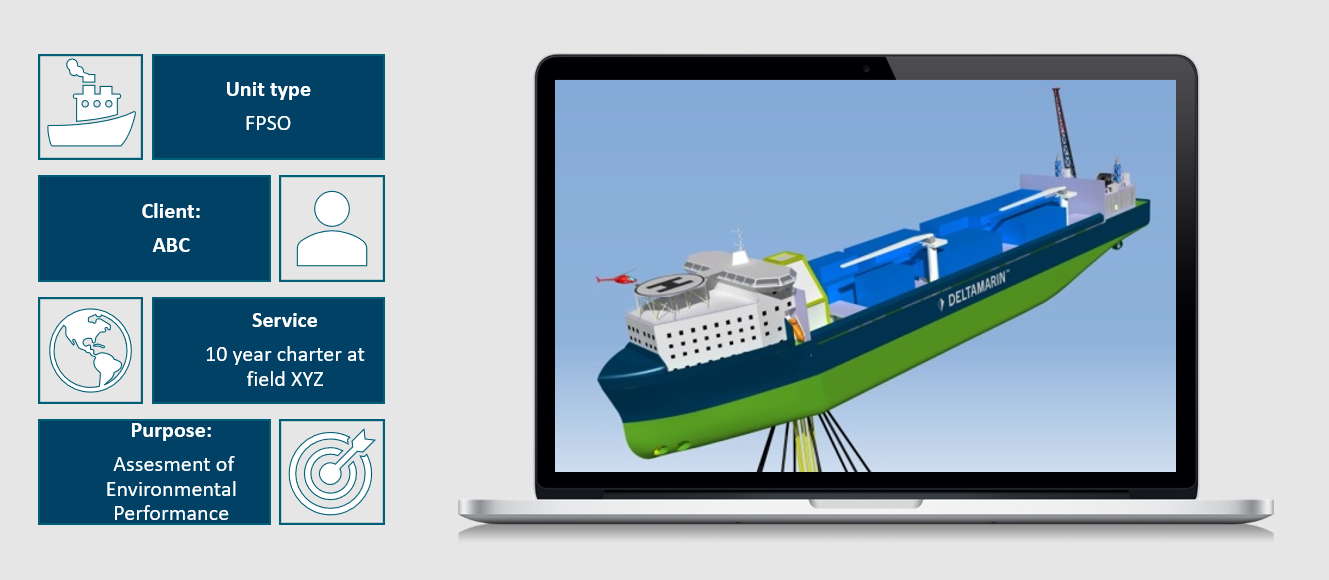
Let’s assume that we have a floating production unit to be deployed at field XYZ for a 10-year lease contract. Now we should perform an Energy & Environmental Performance study to confirm that all sustainability goals addressed by investors and energy major as an end client will be met and the environmental impact over the lease contract will be taken into consideration. How can we approach such a task?
Energy balance and load profile
We start by gathering necessary source data for the energy model. Such source data includes all relevant information starting with available energy sources, power generation philosophy and operations.
The operation profile is basically the most important part of the energy balance. Extreme conditions and peak process capacity often set the design basis for floating production units as they must be produced safely in all possible weather conditions with maximum production capacity. However, when determining the yearly energy consumption or emission values, it’s not reasonable to utilise peak loads, but the load profile must be based as closely as possible on the actual operating profile and conditions.
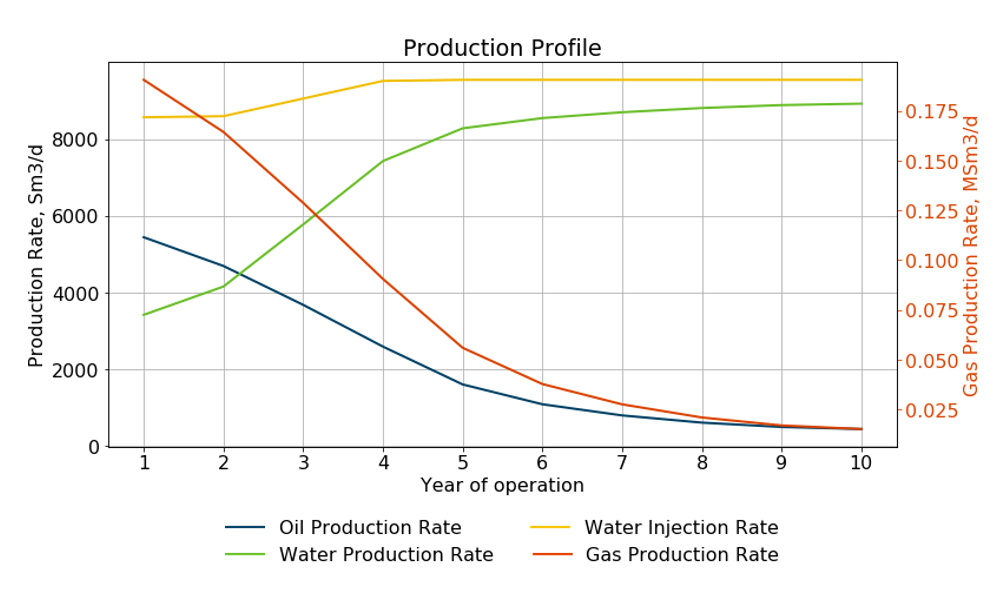
In the case of FPSO, the vessel’s operating profile is determined on the basis of production rates and environmental conditions. For example, during 10 years of deployment in the field, production rates and weather conditions are not constant so they result in a certain load spectrum.
In more detail, the load spectrum can be divided into three groups:
- Production load
- Constant load consumers
- Variable load consumers
The first group includes electric and heat loads directly related to the production of oil, gas and water as well as reinjection. The second group consist of LQ, marine and auxiliary systems, which vary very little and can be considered rather constant. The third group consists of varying consumers, such as DP and thruster systems (if applicable), which are most affected by weather and other external conditions. Finally, by combining these three load groups, we can prepare an estimated total load profile and engine/turbine loads over the entire deployment period.
Energy and fuel consumption
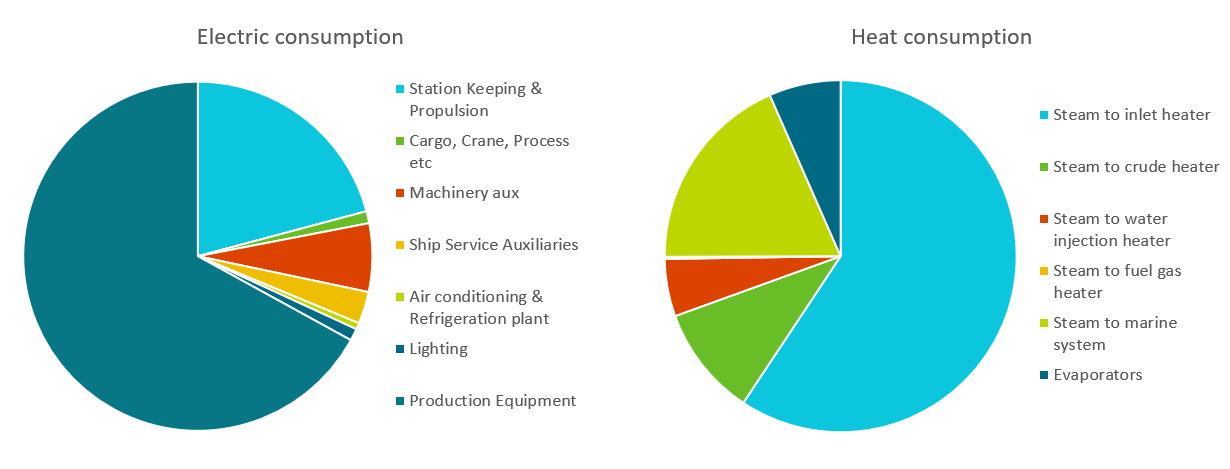
Based on the above load calculations, energy and fuel consumptions over the asset deployment can be analysed. The graph below presents the distribution of electric and heat consumption of the main energy consumables. This is a good basis for future energy studies aiming to look for possible savings and improve energy efficiency.
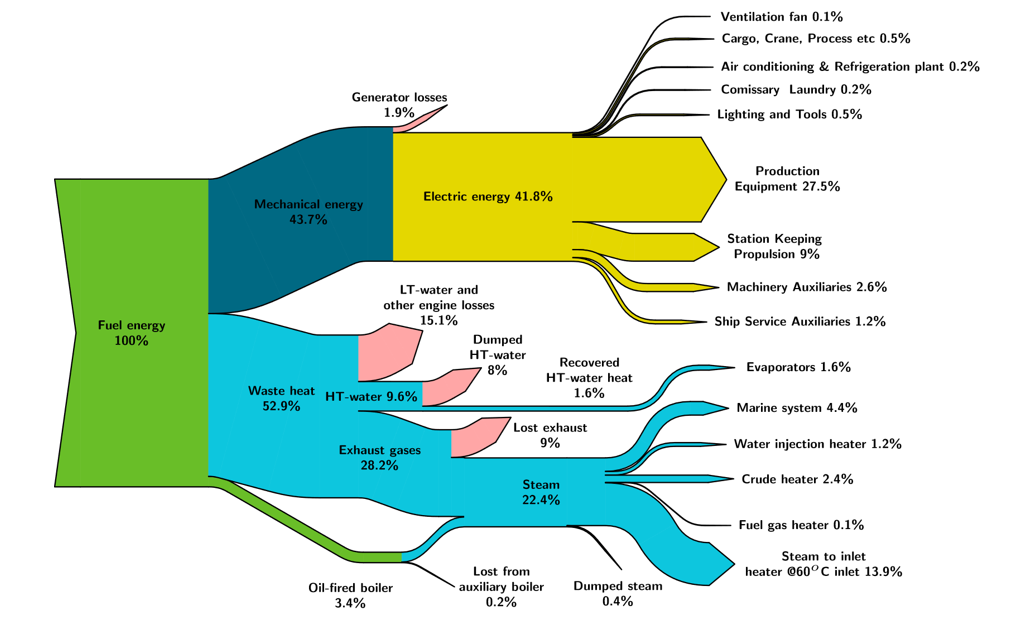
Looking from another perspective, the Sankey-diagram below allows us to get a good idea of how the actual energy flow is distributed from fuel energy to mechanical energy and waste heat. When looking at energy flows on a detail level, we can also identify where we can unlock the greatest potential for improvement.
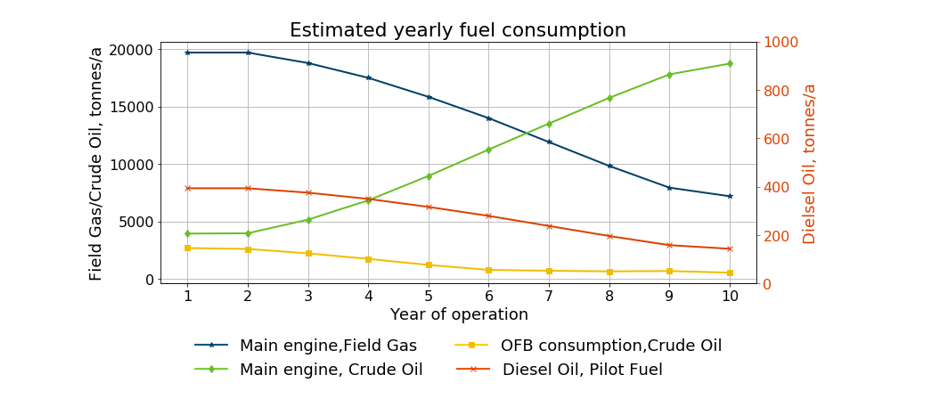
The annual fuel consumption and total fuel distribution over the deployment period in the FPSO case example are presented below. We can clearly identify that the fuel source is expected to shift from field gas to field crude oil after the first four years in operation. We can also see that Oil-Fired Boilers (OFB) are likely to be required almost constantly to produce additional heat for the unit. Thus, regarding possible further analysis, the heat process efficiency could be an easy target for saving some fuel in the vessel.
Emissions
Within this case example, I only focus on emissions to air. In real life, other environmental impacts such as waste, discharge into the sea, chemicals, etc. must also be considered.
Emissions to air can be divided into three groups:
- Emissions from Production & Offloading
- Emissions from Flaring
- Emissions from Power Generation
The first group, emissions from the production side, typically includes fugitive emissions and Volatile Organic Compounds (VOC) from non-point sources such as equipment leaks, valves, flanges and sampling connections, which are not discussed further in this blog.
Flaring typically represents around 10-40% of the total CO2 emissions of FPSOs, so reducing flaring by any means has a direct impact and can significantly reduce GHG emissions to air.
The third group, emissions from power generation, is basically from the engine or turbine combustion process and exhaust gases. Power generation typically represents a major share, 60-90% of the total emissions measured in terms of CO2. Other measured emission components are typically NOx, SOx and Particulate Matter (PM). Emissions are estimated on the basis of annual fuel consumption figures and specific emission coefficients. The estimated CO2 and NOx emissions per year for the case FPSO are presented in the graph below.
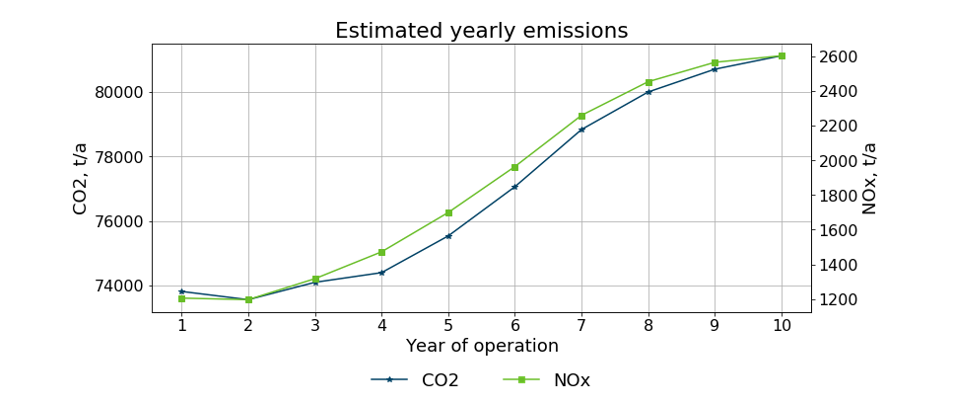
As we can see from the graph above, emissions will start to increase when increasing the use of field crude oil as the main energy source. It is fair to say that the fuel used for power generation has the greatest impact on emissions, if offshore power is not available. However, significant improvements can also be achieved by improving overall energy efficiency and making the right choices with the help of machinery systems.
Since these decisions always come with a certain price tag, I think it’s also good to highlight the impact of governmental guidance through emission regulation and taxation. I’d expect such regulation to make many of today’s ‘alternative’ solutions more attractive and favourable in the years to come. Insofar as we can forecast taxation and fuel prices, a reasonable payback estimation can also be made for technical solutions.
Summary
In fact, most of the above work and studies are nothing new. We have been carrying out such evaluations for years, so why come up with this topic now?
Thanks for asking… I’ve noticed a growing interest in environmental and sustainability questions, especially around GHG emissions. It’s very clear that a single source cannot solve the challenge we are facing with global emissions reduction targets. We need to apply a wide range of sources, including alternative fuels (or clean electricity), new technical solutions (such as carbon capture) and to improve energy efficiency in general to meet the targets in the short- and long term.
The greatest benefit of this analysis method presented here is that all these can be modelled and simulated in a single model by combining different emission reduction sources and looking for opportunities to improve energy efficiency. Once the Best Available Technology (BAT) assessment has been completed, the different technologies can be easily simulated and compared.
Let me know if you would like to learn more about analysing and improving the environmental performance of your fleet.
We are committed and ready to support you in your projects. Let’s make offshore green together!
Want to read more? See also our other published blogs.
For more information, please contact